
Cross-border payments are no longer limited to multinational corporations. Today, businesses of every size rely on international payments to pay suppliers, contractors, employees, partners, and customers across multiple markets.while AI marketing helps many of them reach and engage global customers more effectively.
As payment volumes grow, so does the need to understand how international payments actually perform. How much do they cost? How quickly do they settle? Which payment corridors are improving? Where do businesses lose the most money? And what benchmarks should finance teams use when evaluating payment providers?
Answering these questions requires more than looking at individual payment fees. Cross-border payment performance is influenced by multiple factors, including payment corridors, foreign exchange costs, settlement infrastructure, regulatory requirements, beneficiary data quality, and the payment method itself.
This report brings together the latest cross-border payment statistics from banks, payment providers, industry bodies, and market research to provide a comprehensive view of the market in 2026. The data covers payment volumes, market growth, settlement speed, payment costs, failure rates, regional trends, and adoption patterns, helping businesses benchmark their own payment operations against broader industry performance.
Before comparing statistics, define the market being measured. “Market size” can mean transaction value, provider revenue, wholesale flows, retail flows, remittances, crypto-adjusted flows, or a mix of these. This is why ranking pages often cite very different totals.
Key 2026 benchmarks include:
A cross-border payment is any transaction where money moves between different countries, currencies, or financial systems. While international wire transfers remain one of the most familiar methods, businesses today also send cross-border payments through local payout networks, international ACH, card networks, digital wallets, payment service providers, and other modern payment infrastructure.
The way a payment is processed varies by provider and corridor, but every cross-border transaction typically involves some combination of foreign exchange, payment routing, regulatory checks, settlement, and reconciliation.
This growing variety of cross-border payment methods has contributed to a rapid increase in both the value and volume of international payments. As more businesses expand globally, cross-border payments have become a core part of international commerce rather than a specialist banking activity.
The size of the global cross-border payments market depends on what is being measured. Some estimates focus on traditional banking and commercial payment flows, while others include broader financial activity and crypto-enabled transactions. As a result, there is no single definitive market-size figure.
Because these flows respond to broader global financial trends, currency swings, interest-rate shifts, and changing trade patterns - the same market can be measured in very different ways depending on what's counted.
The following benchmarks provide useful context for understanding the scale of international payments.
The IMF's estimate of approximately $1 quadrillion is the broadest because it captures a much wider universe of international payment activity, including both traditional financial flows and crypto-enabled transactions. For this reason, it should not be compared directly with commercial market-sizing estimates.
By comparison, FXC Intelligence estimated the total addressable wholesale and retail cross-border payments market at $194.6 trillion in 2024. Within that total, it estimated:
McKinsey estimated approximately $179 trillion in cross-border payment flows during 2024. Its research also highlights an important industry dynamic: although lower-value consumer and remittance payments account for a smaller share of total transaction value, they generate a disproportionately larger share of industry revenue because fees represent a higher percentage of each transaction.
Taken together, these estimates show that B2B and wholesale payments dominate international payment value, driven by corporate trade, treasury operations, financial institutions, and large commercial transactions. Consumer payments, ecommerce, and remittances represent a much smaller share of total value, but remain highly visible because pricing, foreign exchange margins, and transaction fees have a greater impact on each payment.
For most businesses, the visible transfer fee represents only a fraction of the total cost of sending money internationally. Foreign exchange spreads, intermediary-bank deductions, payment failures, reconciliation effort, and liquidity management often have a greater impact on the overall economics of a payment.
This is why finance teams increasingly evaluate total landed cost rather than comparing provider fees alone.
The G20 has identified reducing the cost of cross-border payments as one of its primary objectives. Despite ongoing improvements, pricing continues to vary significantly depending on the payment corridor, currency pair, payment method, and provider.
The World Bank’s RPW Q3 2025 benchmark found that sending $200 globally cost 6.36% on average. Digital remittances averaged 4.59%, compared with 7.30% for non-digital services.
The UN and G20 target is a 3% global average for remittances, with no corridor above 5%. For retail cross-border payments, the Financial Stability Board target is a global average cost of no more than 1%, with no corridors above 3%, by end-2027.
Business payments need a different lens. A $50 fee on a $10,000 supplier payment is only 0.5%. But repeated FX spreads of 50 to 150 basis points across AP or treasury flows can exceed visible fees.
For Fuze Finance customers, the practical benchmark is all-in cost per corridor. That means visible fees, FX spread, deductions, and operational effort should be measured together.
These benchmarks should be treated as market indicators rather than universal pricing. A payment sent from the United States to the United Kingdom may have very different economics from one sent to Southeast Asia, Latin America, or Africa. Even within the same corridor, costs can vary depending on payment value, settlement urgency, and whether funds move through local payout infrastructure or correspondent banking.
Foreign exchange remains one of the largest hidden cost drivers. Providers advertising low transfer fees may recover costs through wider FX spreads, making it important to compare the exchange rate against an independent benchmark rather than the transfer fee alone.
Intermediary-bank deductions also continue to affect many international wire transfers. When correspondent banks participate in settlement, fees may be deducted before the beneficiary receives the payment, making the final received amount different from the amount originally sent.
For this reason, businesses should benchmark payments at the corridor level, measuring:
Looking at these metrics together provides a far more accurate picture of payment efficiency than comparing provider fees in isolation.
Settlement speed has improved considerably over the past decade, but there is still no single benchmark that applies to every international payment.
How quickly a payment arrives depends on several factors, including the payment corridor, currency pair, banking hours, compliance reviews, beneficiary-bank processing, and the payment rail used. Two payments sent through the same provider can settle at different speeds simply because they follow different routes or destination-market requirements.
This is one reason businesses increasingly evaluate providers using corridor-specific settlement performance instead of relying on global averages.
Swift is the clearest example of this distinction. Swift states that 75% of Swift payments reach the beneficiary bank within 10 minutes and over 90% within one hour. It also says the “last mile” between beneficiary-bank receipt and end-customer credit accounts for more than 80% of total end-to-end payment time.
The FSB’s 2024 progress report shows the same gap. For wholesale payments over Swift, 50.6% credited funds within one hour and 92% within one business day.
Retail cross-border payment services were further from target. Only 33.5% settled within one hour and 69% within one business day. Remittance services reached 54% within one hour and 76.6% within one business day.
The continued rollout of local payment infrastructure, improved correspondent banking processes, and initiatives such as Swift GPI have significantly reduced settlement times across many international payment corridors. At the same time, providers are increasingly combining multiple payment rails to improve delivery speed where local infrastructure is available.
Despite these improvements, businesses should avoid assuming that every international payment can settle instantly. Regulatory reviews, beneficiary-bank processing, public holidays, banking cut-off times, and inaccurate payment information can still introduce delays, even when modern payment infrastructure is used.
For finance teams, settlement speed should therefore be measured alongside payment certainty. A payment that consistently arrives within its expected service level is often more valuable than one that is occasionally faster but less predictable.
For further insights, read: Fastest Cryptocurrencies for Cross-Border Payments
Unlike payment volumes or transaction costs, cross-border payment failure rates are not measured using a universal industry standard. Providers use different definitions for terms such as failed, returned, rejected, declined, and delayed, making direct comparisons difficult.
For this reason, finance teams should treat published failure-rate statistics with caution and instead measure payment performance using their own operational data. Tracking failures by corridor, payment method, and reason code provides far more actionable insights than relying on a single industry-wide benchmark.
While the exact failure rate varies between providers and payment types, the most common causes of cross-border payment failures remain consistent across the industry. These include incorrect or incomplete beneficiary information, sanctions and AML reviews, false positives during fraud screening, unsupported currencies or payout methods, insufficient funds, expired FX quotes, payment-limit restrictions, correspondent-bank rejections, and formatting mismatches between domestic payment systems and international messaging standards.
Industry guidance supports these findings. Swift identifies inaccurate beneficiary information as one of the leading reasons international payments are delayed or fail to reach the intended recipient. Similarly, BIS Nexus notes that richer and more structured payment data can reduce false-positive sanctions screening and improve straight-through processing. Missing or incomplete recipient information can trigger additional compliance reviews or cause payments to be rejected altogether.
When reviewing published failure-rate statistics, businesses should always verify how the provider defines a "failed" payment and whether delays, returns, or rejected transactions are included in the reported figures. For operational benchmarking, internal payment logs often provide the most meaningful measure of payment reliability, particularly when analysed by corridor and failure reason rather than as a single aggregate metric.
Cross-border payment performance varies considerably across regions. Differences in payment infrastructure, banking systems, regulation, currency controls, and local clearing networks mean that the experience of sending money internationally is rarely the same from one corridor to another.
Some markets benefit from extensive local payment infrastructure and highly connected banking systems, while others continue to rely heavily on correspondent banking relationships. These differences affect settlement speed, pricing, payment transparency, and the likelihood of delays or intermediary deductions.
High-volume corridors often have more providers, deeper liquidity, stronger pricing competition, and more established payout options. Lower-volume or higher-risk corridors often involve more intermediaries, higher compliance overhead, fewer local partners, and weaker interoperability.
Speed also depends on local realities. Bank cutoffs, domestic payment-system hours, regulatory reporting, FX controls, and manual reviews can all affect the final result.
The World Bank RPW Q3 2025 data shows the cost gap clearly. Sub-Saharan Africa remained among the highest-cost receiving regions at 8.46% for sending $200. South Asia was lower at 5.30%.
Sending $200 from G20 countries averaged 6.39%. That is still far above the 3% remittance target.
APAC is a useful region to watch for real-time payment links. Project Nexus is moving toward live implementation with participants including Malaysia, the Philippines, Singapore, Thailand, and India. Indonesia is involved as a special observer.
For businesses, these regional differences reinforce the importance of evaluating payment providers at the corridor level rather than relying on global performance claims. A provider that performs exceptionally well in one region may deliver very different results in another depending on local partnerships, payment rails, and regulatory coverage.
Understanding regional performance also helps finance teams set realistic expectations for settlement times, payment costs, and operational planning across different international markets.
International payment infrastructure continues to evolve as businesses demand faster settlement, greater transparency, and lower operational costs.
Banks, fintechs, payment service providers, and regulators are investing in technologies that improve payment visibility, automate compliance, expand local payout capabilities, and reduce dependence on traditional correspondent banking.
Fintech platforms are gaining traction with SMEs and mid-market companies. They can offer multi-currency accounts, batch supplier payments, transparent FX, and easier vendor onboarding. McKinsey says 35% to 50% of surveyed SMEs and mid-corporates in North America, Europe, and Emerging Asia used a fintech or nontraditional provider for cross-border payments in the prior year.
Wallets and mobile money are important for retail, remittance, creator, and marketplace payouts. They are especially useful where bank-account penetration or local card acceptance is uneven.
Real-time payment links are another major trend. Project Nexus aims to standardize connections between domestic instant payment systems. The goal is one connection that can reach multiple participating countries.
ISO 20022 is also central. Richer, more structured payment data can improve interoperability, straight-through processing, compliance screening, and reconciliation. CPMI’s updated 2026 report encourages consistent implementation by end-2027.
Stablecoins and tokenized money may support always-on settlement, treasury movement, and selected payout flows. But businesses must address regulation, reserves, off-ramps, custody, accounting, auditability, and counterparty acceptance.
Adoption does not mean every payment should move to a new rail. The practical question is which corridors show measurable improvement in cost, speed, or success rate.
For businesses, these trends translate into greater flexibility when choosing how international payments are sent. Instead of relying on a single payment rail, organizations increasingly combine multiple payment methods depending on the destination, payment value, recipient type, and operational requirements.
At the same time, adoption of modern payment infrastructure does not eliminate the need for strong operational controls. Foreign exchange management, beneficiary verification, reconciliation, and regulatory compliance remain critical regardless of the technology used to move funds.
Payment statistics are most valuable when they are used as benchmarks rather than targets.
A global average settlement time or transfer cost provides useful market context, but it should not become the basis for evaluating your own payment operations. Performance varies by payment corridor, currency pair, provider, transaction value, beneficiary type, and compliance requirements.
Instead, businesses should compare their own payment performance against the markets and corridors that matter most to them.
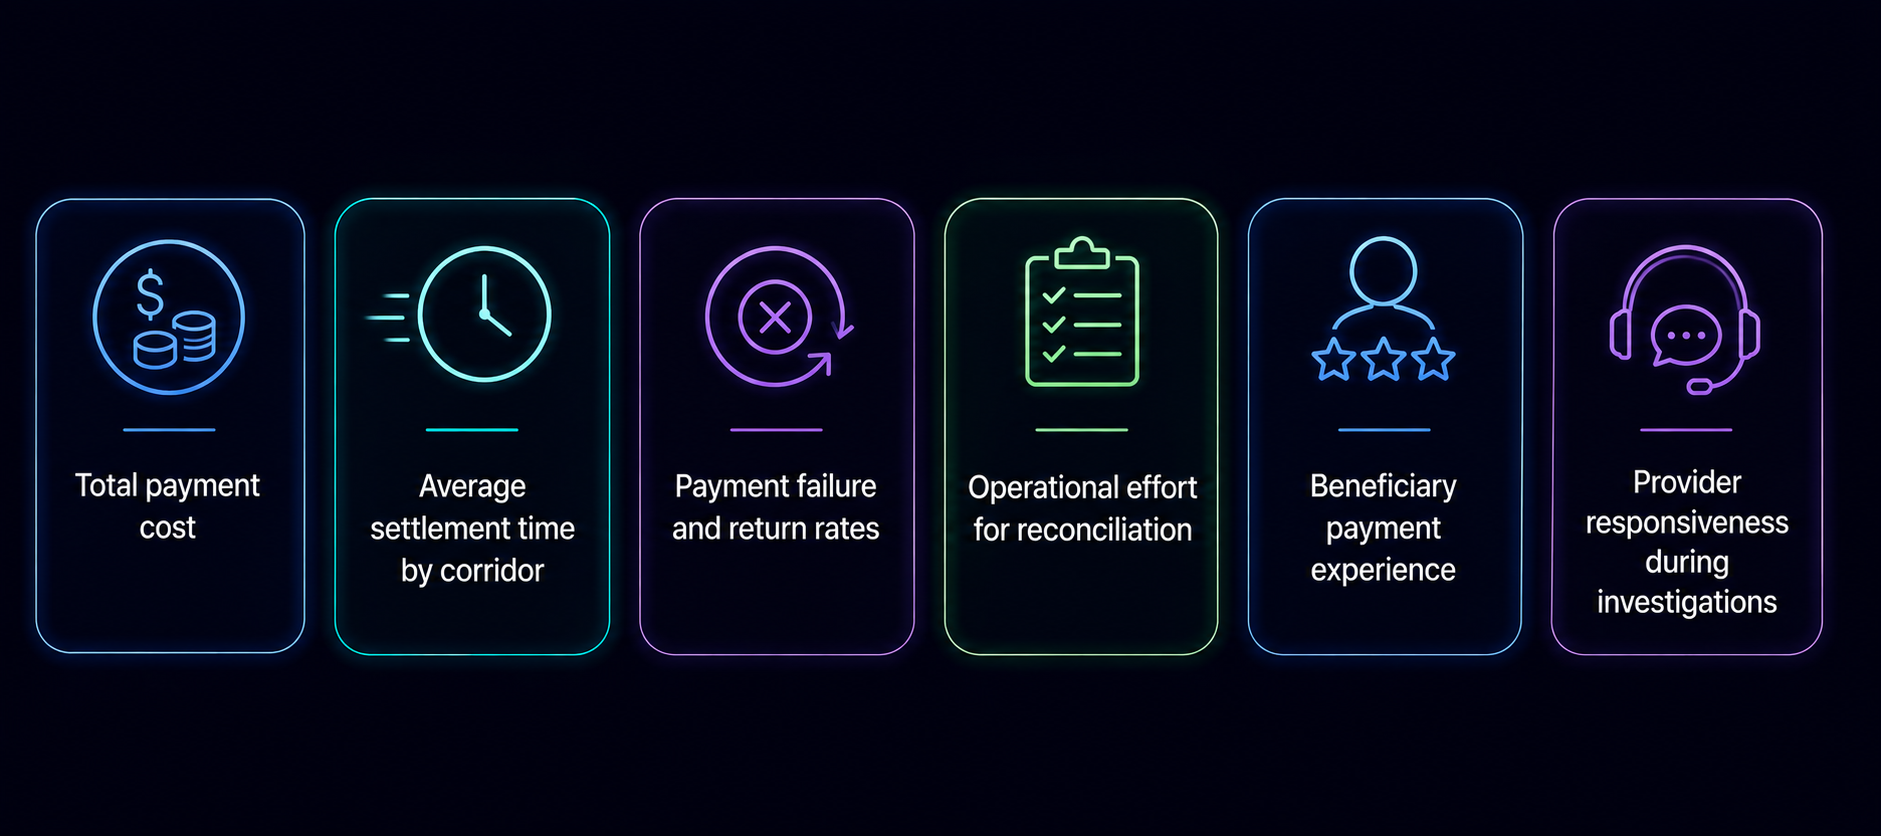
A practical benchmarking framework includes measuring:
Tracking these metrics consistently provides a far more meaningful view of payment performance than comparing provider marketing claims or headline pricing.
Understanding market statistics is only valuable when they help improve real payment performance.
Businesses processing international payments should benchmark their own operations against the metrics that have the greatest financial impact, total payment cost, foreign exchange efficiency, settlement reliability, payment visibility, and operational workload.
Fuze Finance helps businesses simplify cross-border payments through regulated payment infrastructure, competitive FX execution, local payout capabilities, and transparent settlement across supported corridors. Instead of relying on headline pricing, finance teams gain greater visibility into how international payments are routed, settled, and reconciled.
As payment volumes continue to grow, choosing the right payment infrastructure becomes as important as choosing the right payment provider. Organizations that continuously benchmark payment performance are better positioned to reduce costs, improve settlement reliability, and scale international operations more efficiently.


%20(1)%20(1).png)