
Stablecoin infrastructure has evolved far beyond its origins as crypto-market liquidity. Today, it has become an important consideration for fintech founders, payment providers, treasury teams, and enterprises evaluating faster settlement, programmable money movement, and global payment infrastructure.
The numbers tell a story of rapid growth, but they also require careful interpretation.
Stablecoin supply continues to expand, transaction volumes are reaching new highs, and wallet activity is increasing across multiple blockchain networks. Yet these metrics measure different aspects of the ecosystem. A trillion dollars in blockchain transfers does not necessarily represent a trillion dollars in real-world business payments.
Understanding that distinction is essential when evaluating stablecoins as payment infrastructure rather than simply as crypto assets.
This guide examines the latest stablecoin infrastructure statistics and explains what each metric actually measures. The goal is to help businesses evaluate adoption using reliable operational indicators rather than headline figures alone.
Methodology note: Headline blockchain transfer volume, adjusted transaction volume, and payment-specific transaction volume measure different things and should never be compared directly.
Raw blockchain activity includes exchange transfers, market-making activity, smart-contract interactions, treasury rebalancing, bridge transfers, and automated transactions. Adjusted volume attempts to remove much of this noise, while payment-specific volume focuses on transactions associated with real-world commercial payments.
For businesses evaluating stablecoin infrastructure, this distinction is critical. The important question is not simply "How large is the market?" but "Does this infrastructure improve settlement speed, liquidity, reconciliation, or operating costs for our payment workflows?"
Stablecoin infrastructure is the collection of systems that enables businesses to issue, hold, transfer, convert, monitor, and reconcile stablecoins in production.
The token itself is only one component. To move money reliably, businesses also need secure wallets, custody, liquidity, compliance controls, reporting, accounting workflows, and dependable connections between traditional banking systems and blockchain networks.
A production-ready infrastructure stack typically includes several interconnected layers:
A useful way to think about the ecosystem is to separate the asset from the infrastructure.
A stablecoin is simply a digital asset designed to maintain a stable value, typically against a fiat currency such as the U.S. dollar.
Stablecoin infrastructure is everything that allows businesses to use that asset operationally—from moving funds and managing liquidity to meeting compliance requirements and reconciling transactions.
A simple analogy helps.
Stablecoins are the digital dollars moving through the system. Stablecoin infrastructure is the banking, wallet, compliance, treasury, and API layer that makes those digital dollars usable for real business operations.
As enterprise adoption grows, businesses increasingly evaluate integrated infrastructure rather than individual components. Instead of assembling separate providers for custody, fiat connectivity, compliance, liquidity, and payment routing, many organizations now prefer platforms that combine these capabilities through a single integration.
Market Size and Supply Growth
Market capitalization, or circulating supply, is the clearest indicator of how much stablecoin liquidity exists within the financial system. Unlike transaction volume, it measures the total value of stablecoins currently available for settlement, trading, treasury operations, and payments.
Stablecoin supply has expanded dramatically over the past five years. What began as a relatively small crypto-market utility has grown into a digital-dollar ecosystem exceeding $300 billion.
The Federal Reserve estimated aggregate stablecoin market capitalization at approximately $317 billion on April 6, 2026, following more than 50% growth during 2025. Although growth moderated toward the end of 2025 and early 2026, the overall trajectory continues to demonstrate rapid expansion.
McKinsey similarly noted that circulating stablecoin supply had surpassed $300 billion, compared with less than $30 billion in 2020, an increase of roughly tenfold in just five years.
Growth, however, has not been evenly distributed across the market.
FATF reported that more than 250 stablecoins were in circulation by mid-2025. Yet liquidity remains concentrated in a small number of assets. According to a16z's 2025 analysis, USDT and USDC together accounted for 87% of total stablecoin supply.
That concentration matters because liquidity, exchange support, banking relationships, and enterprise payment infrastructure are strongest around the largest stablecoins. For businesses evaluating stablecoin payments, market share often matters more than the total number of available tokens.
A chart works particularly well in this section:
Because reporting methodologies differ by provider, including token coverage, bridged assets, and supported blockchains, small differences between published totals are expected. The broader conclusion, however, is consistent across institutional research: stablecoin liquidity has expanded rapidly and continues to grow.
This is the most important concept in stablecoin infrastructure statistics.
Large transaction-volume numbers often attract attention, but they are not all measuring the same thing. Understanding the difference is essential for building a credible business case.
Stablecoin activity is generally reported using three different metrics:
Headline on-chain volume measures the total value of transactions recorded on blockchain networks.
It is useful for understanding overall network activity, but it is not a direct measure of payment adoption. The figure includes far more than commercial payments, such as:
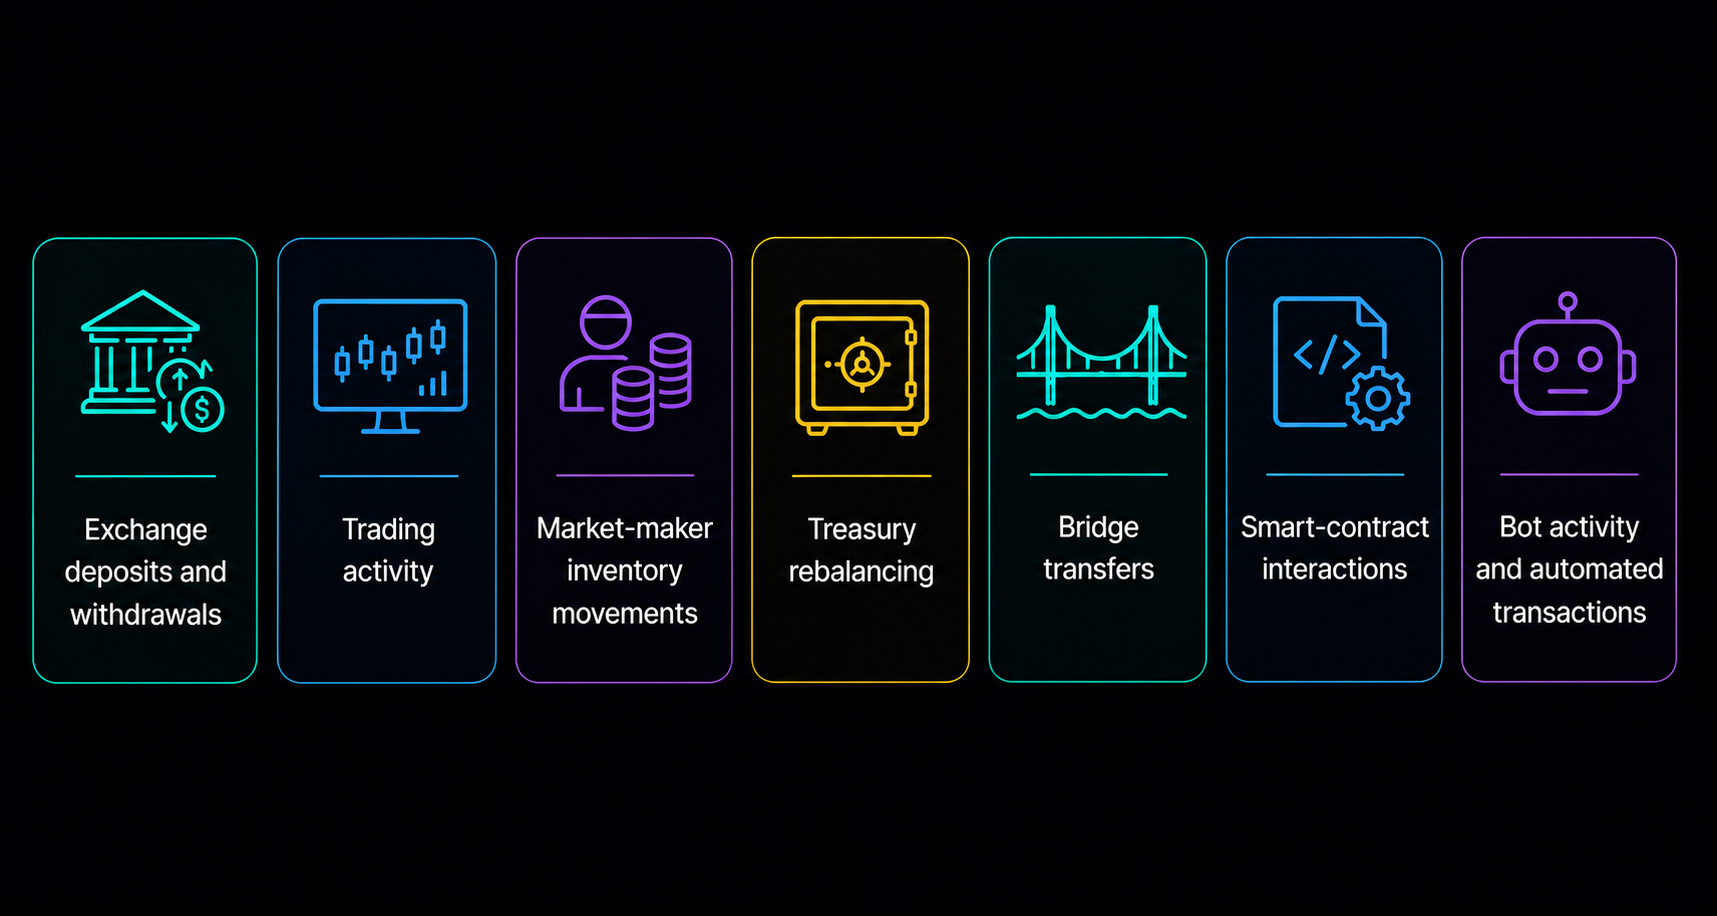
As a result, headline transfer volume almost always overstates the amount of money being used for real-world business payments.
Adjusted transaction volume attempts to provide a more realistic picture of organic network activity by filtering out much of the artificial or repetitive blockchain traffic.
Visa's Stablecoin Analytics Dashboard, built with Allium Labs, adjusts for factors such as bots, high-frequency wallets, and other non-organic transactions before calculating volume.
Using this methodology:
Adjusted volume provides a much better view of overall network usage than raw blockchain transfers. However, it still captures many transactions that are unrelated to commercial payments.
For payment companies, fintechs, and treasury teams, payment-specific volume is the most meaningful metric.
Rather than measuring all blockchain activity, it attempts to isolate transfers associated with real-world commercial payments.
McKinsey and Artemis estimated that stablecoin payments reached approximately $390 billion on an annualized basis, based on activity observed in December 2025.
Their breakdown included:
These figures illustrate an important point: payment adoption is growing rapidly, but it remains significantly smaller than overall blockchain transfer activity.
Using the wrong metric can easily overstate stablecoin adoption.
Rather than saying:
"Stablecoins processed more than $10 trillion in payments."
A more accurate statement is:
Adjusted stablecoin transaction volume is measured in the trillions of dollars, while identified real-world payment volume remains much smaller but continues to grow across specific business use cases.
That distinction helps separate network activity from commercial adoption and results in a much more defensible business case.
For payment providers such as Fuze Finance, the operational question is not how many dollars move across blockchains overall. It is whether stablecoin rails improve settlement speed, liquidity, payment costs, treasury efficiency, or reconciliation for a specific payment workflow.
Wallet and address metrics are among the most frequently cited indicators of stablecoin adoption. They are useful for measuring network activity, but they should not be interpreted as a direct count of users or businesses.
An on-chain address simply records blockchain activity. One individual or company may control dozens of addresses, while a single custodial wallet operated by an exchange or fintech platform may represent thousands, or even millions, of end users.
That distinction is important when evaluating adoption.
Visa notes that a custodial wallet address can represent multiple users, meaning wallet counts are better viewed as trend indicators than as measures of unique adoption.
The same point appears in a16z's 2025 analysis. The firm estimated roughly 40–70 million active crypto users, compared with approximately 181 million monthly active on-chain addresses. The gap illustrates why address growth should never be treated as a proxy for user growth.
Instead, wallet activity is most valuable when analyzed alongside other operating metrics, such as transaction frequency, payment value, or repeat business activity.
Different wallet metrics answer different questions.
Rather than focusing on address counts alone, businesses should combine these metrics with operational indicators, including:
These measures provide a much clearer picture of commercial adoption than wallet growth in isolation.
Chain-specific activity also varies considerably.
Visa reported that monthly active addresses on Solana increased by 608% over the previous 24 months, compared with 89% growth on Ethereum during the same period. While this demonstrates strong network momentum, it does not necessarily indicate that Solana has more business users or commercial payment volume.
For enterprise payment teams, the most meaningful indicators remain integrated businesses, recurring payees, successful settlements, and corridor-level activity, not raw blockchain addresses.
Which Stablecoins and Blockchains Dominate Infrastructure?
When evaluating stablecoin infrastructure, businesses should focus on liquidity, ecosystem support, and operational reliability rather than overall market popularity.
Today, the market remains highly concentrated.
USDT is the largest stablecoin by circulating supply and plays a central role in crypto-market liquidity, exchange trading, and dollar access across many emerging markets.
USDC has become the preferred choice for many regulated fintechs, institutional platforms, and payment providers. Circle states that USDC is redeemable 1:1 for U.S. dollars and backed by highly liquid cash and cash-equivalent assets.
Other stablecoins, including PYUSD, EURC, RLUSD, and newer issuer-backed assets, continue to grow, but their market share remains significantly smaller than that of USDT and USDC.
Blockchain selection is equally important because the same stablecoin can exist across multiple networks.
Choosing a settlement network is ultimately a business decision rather than a technical one.
Finance and payment teams should evaluate:
The most popular blockchain is not automatically the best choice. The right infrastructure depends on the payment corridor, supported counterparties, regulatory requirements, and the operational needs of the business.
Stablecoin infrastructure is gaining traction where traditional payment rails create operational friction—not as a universal replacement for existing payment systems.
Today, adoption is strongest in workflows that benefit from faster settlement, improved liquidity management, or greater flexibility across borders.
Common business applications include:
Despite growing adoption, stablecoins are not replacing every payment rail equally.
Research from McKinsey and Artemis suggests that real-world payment activity remains concentrated in a relatively small number of proven commercial use cases rather than broad consumer payments.
Their estimates show:
Supporting this trend, Castle Island Ventures and Artemis reported $94.2 billion in stablecoin payments processed between January 2023 and February 2025 across 31 stablecoin payment companies, with B2B payments representing the largest category.
Enterprise interest is also increasing.
A Fireblocks 2025 survey found that:
For businesses evaluating stablecoin payments, the most effective starting point is not selecting a blockchain or token. It is identifying a payment workflow where existing infrastructure creates measurable friction.
Instead of asking "Should we use stablecoins?", finance teams should ask:
Those questions produce a far stronger business case than comparing transaction fees alone.
Stablecoin adoption is highly uneven across global markets because local economic conditions, banking infrastructure, regulation, and payment needs differ significantly from one region to another.
Rather than growing uniformly, adoption tends to accelerate where stablecoins solve a specific operational or financial problem.
Some of the most common adoption drivers include:
Several regional trends stand out.
In Latin America and the Caribbean, stablecoin adoption is frequently associated with dollar demand, inflation protection, remittances, and cross-border commerce. IMF research found stablecoin flows equivalent to 7.7% of GDP in its 2024 transaction analysis.
Across Africa and the Middle East, the IMF estimated stablecoin flows equal to 6.7% of GDP, while Chainalysis has highlighted growing use across remittances, commerce, and inflation-sensitive economies.
In Southeast Asia, adoption is often linked to mobile-first financial services, international commerce, and cross-border employment. Meanwhile, IMF research observed net stablecoin outflows from North America, reflecting continued global demand for dollar-denominated digital assets.
Because blockchain transactions do not contain geographic information, regional estimates should always be interpreted carefully. Most research relies on exchange data, wallet clustering, and transaction modeling rather than direct location information.
For that reason, phrases such as "research suggests," "data providers estimate," or "tracked flows indicate" are more appropriate than presenting regional figures as precise measurements.
Businesses evaluating stablecoin infrastructure should compare total operating costs—not just blockchain transaction fees.
A low-cost on-chain transfer can still become expensive once custody, compliance, FX conversion, liquidity management, reconciliation, and operational overhead are included.
The table below provides a practical comparison of major payment rails.
Cost comparisons should always extend beyond visible transaction fees.
Finance teams should evaluate the all-in cost of ownership, including:
A payment that appears inexpensive on-chain can ultimately become more costly if it introduces additional operational work or requires manual intervention.
Rather than focusing on transaction fees alone, treasury teams should evaluate stablecoin infrastructure using the same framework they apply to any payment rail.
Key questions include:
For payment platforms such as Fuze Finance, the strongest business cases typically combine multiple operational improvements rather than relying on lower transaction fees alone. Faster settlement, improved liquidity management, reduced prefunding, programmable payment workflows, and automated reconciliation often create more value than network-cost savings by themselves.
The long-term viability of stablecoin infrastructure depends as much on trust and governance as on transaction speed.
Businesses evaluating providers should assess not only the technology but also the financial, operational, and regulatory controls supporting the payment workflow.
Several factors deserve close attention:
Recent regulatory developments have significantly reshaped the market.
The GENIUS Act became Public Law No. 119-27 on July 18, 2025, establishing a federal framework for payment stablecoins in the United States.
Within the European Union, the Markets in Crypto-Assets Regulation (MiCA) introduced harmonized rules for crypto-asset issuers, wallet providers, exchanges, and other service providers. According to the European Commission, MiCA establishes organizational, operational, and prudential requirements across the sector.
Global regulators have also emphasized financial-crime controls. FATF has warned that broader stablecoin adoption could increase illicit-finance risks if AML and CFT standards are not implemented consistently across jurisdictions.
Issuer transparency remains another important consideration. For example, Circle states that USDC is backed by highly liquid cash and cash-equivalent assets and publishes reserve reporting. Businesses should treat this as one factor within a broader due-diligence process rather than as a standalone endorsement.
Ultimately, stablecoin infrastructure reduces some forms of payment friction while introducing new operational dependencies. Businesses must evaluate issuer concentration, reserve quality, blockchain reliability, custody arrangements, regulatory oversight, and counterparty risk alongside traditional measures such as cost and settlement speed.
Stablecoin adoption is evolving quickly, making it important to distinguish long-term trends from short-term market headlines.
Rather than focusing on a single statistic, businesses should monitor a balanced set of indicators covering market size, payment activity, operational readiness, and regulatory maturity.
Looking at these metrics together provides a much clearer picture than relying on a single headline number. For example, rapid growth in market capitalization does not necessarily indicate higher payment adoption, while increasing payment volume alone says little about regulatory readiness or operational resilience.
The value of stablecoin infrastructure statistics depends on the decision you're trying to make.
Fintech founders should use them to identify payment corridors where stablecoins can improve settlement speed, liquidity, or customer experience before investing in new infrastructure.
Payments teams should compare stablecoin rails with ACH, wire transfers, cards, and cross-border payment providers based on total cost, settlement speed, reconciliation effort, and compliance requirements rather than blockchain transaction fees alone.
Treasury leaders should focus on issuer concentration, liquidity management, custody controls, redemption processes, accounting treatment, and operational risk alongside settlement performance.
Executive stakeholders should separate three distinct narratives:
Confusing these metrics can easily lead to unrealistic expectations about stablecoin adoption.
For businesses evaluating production deployments, the strongest decisions come from corridor-level analysis rather than industry-wide statistics. Measuring settlement speed, operating costs, reconciliation efficiency, liquidity requirements, and regulatory readiness provides a much stronger foundation than relying on headline transaction-volume figures.
Implementing stablecoin payments requires more than choosing a blockchain or a stablecoin. Businesses also need secure custody, compliant onboarding, liquidity management, fiat on/off-ramps, payment orchestration, and reconciliation that integrates with existing finance workflows.
Fuze Finance provides the infrastructure businesses need to move from stablecoin experimentation to production. Through a single platform and API, businesses can manage stablecoin wallets, automate cross-border payments, access liquidity, convert between fiat and stablecoins, and build compliant payment workflows with enterprise-grade controls.
Whether you're launching a fintech product, modernizing treasury operations, or exploring stablecoin-powered cross-border payments, Fuze helps you build reliable, scalable payment infrastructure without stitching together multiple providers.


%20(1)%20(1).png)